Soken DAC-BHW-6 - Electrical Steel Sheet Tester
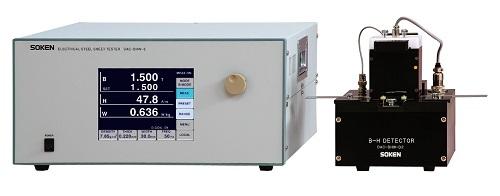

The Steel Sheet Tester Model DAC-BHW-6 is capable of measuring magnetic flux density (B), magnetizing force (H), and core loss (W) of an electromagnetic steel sheet (a single strip sheet). With PC software, a hysterics curve is drawn in a PC, and the data can be saved and recalled for further analysis.
Test Specimens
Oriented and non-oriented core in sheet
Various graph processing (Software)
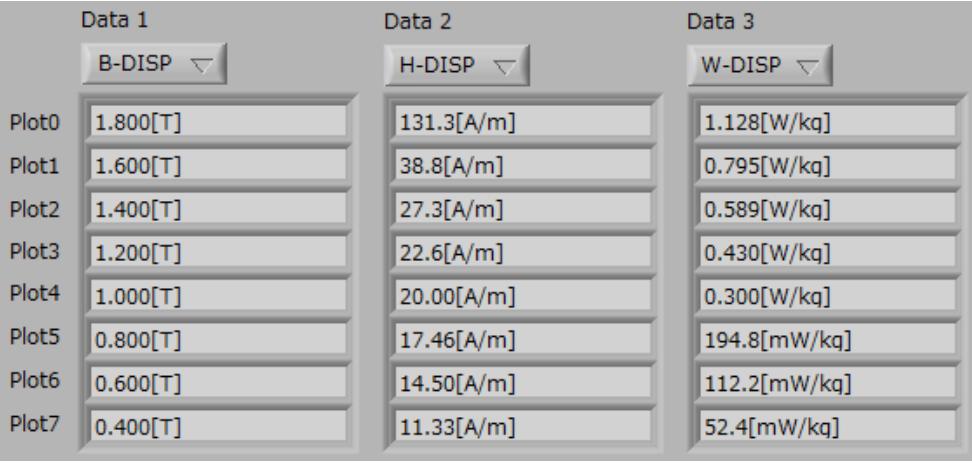
- B-H Graph: B-H Characteristics (flux density vs. magnetizing force)
- B-W Graph: B-W Characteristics (flux density vs. core loss)
- W-F Graph: W-F Characteristics (iron loss vs. frequency)
- μ-F Graph: µ-F Characteristics* (permeability vs. frequency) *µ is calculated from B/H.
- W Discrimination: Eddy current loss and Hysteresis loss are discriminated against from Iron loss.
Advantages
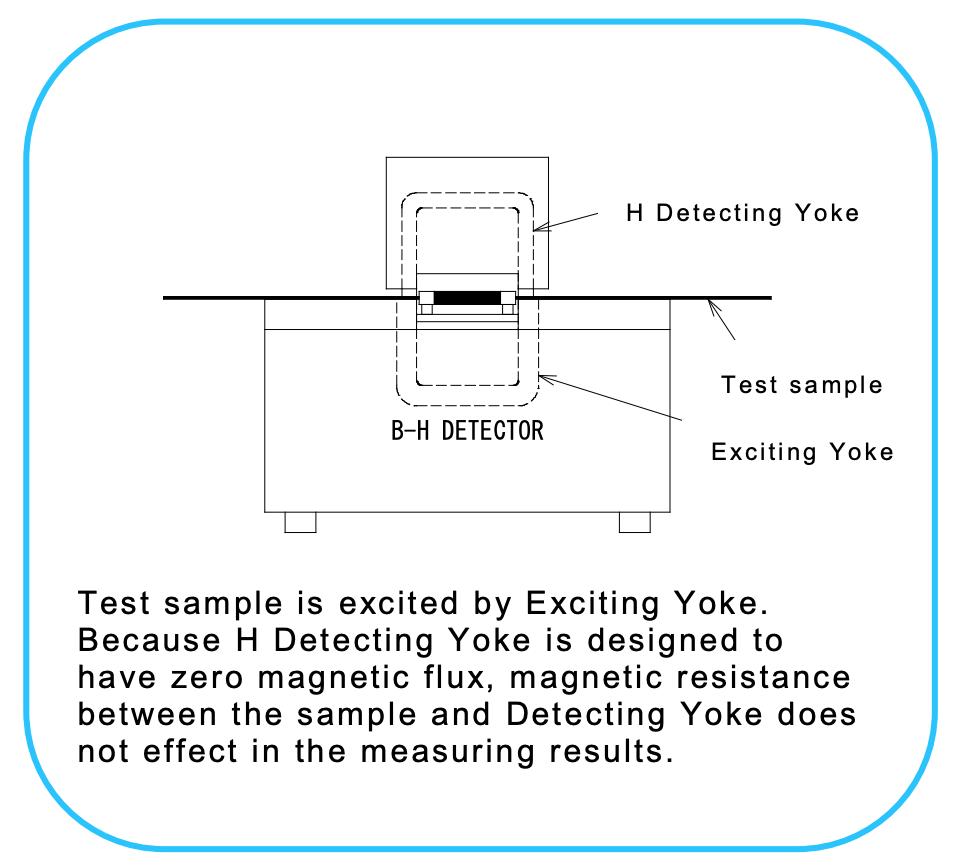
Apply Magnetic Potentiometer Method into the Magnetic circuit
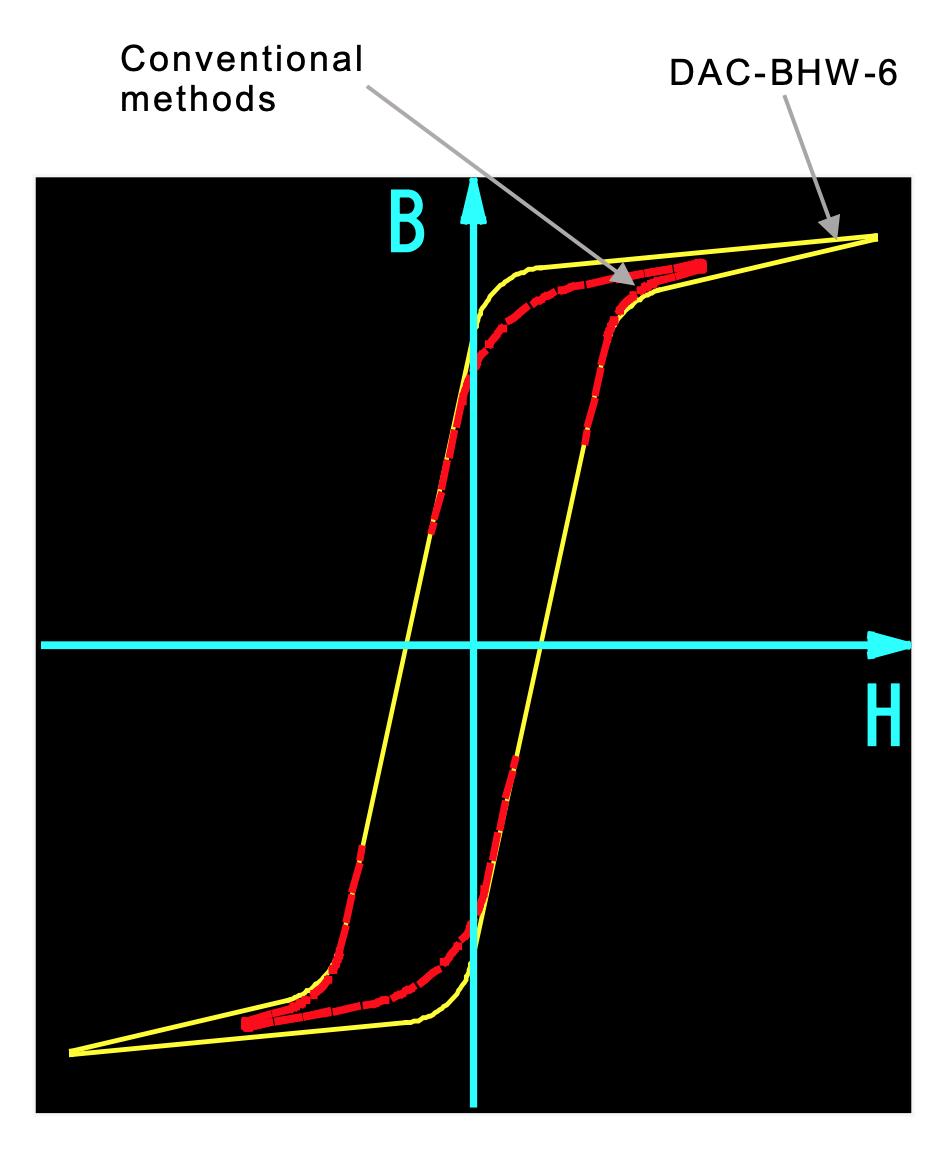
The Steel Sheet Tester Model DAC-BHW-6 is capable of measuring magnetic flux density (B), magnetizing force (H), and core loss (W) of an electromagnetic steel sheet (a single strip sheet). The measuring method of DAC-BHW-6 differs from the conventional Single Sheet Test (SST) of IEC in that it applies the Magnetic Potentiometer method into the magnetic circuit. The tester measures a magnetic potential between 2 points in the magnetic field. In this style, stable and reliable measurement is possible because the measurement is unaffected by a gap between a test sample and a detecting yoke.
Combining an external measuring detector and a built-in power source, DAC-BHW-6 provides 2 measuring modes, B mode, and H mode. In B mode, using magnetic flux density (B) as a parameter, magnetizing force (H) and core loss (W) is measured. In H mode, using magnetizing force (H) as a parameter, magnetic flux density (B) and core loss (W) is measured. DAC-BHW-6 is calibrated on the bases of the values measured by EPSTEIN, and the test results are closely coincident with data obtained by EPSTEIN Method. When variations in data of sample points are large, you ought to measure as many points as possible and get a mean value. Then, you can obtain better results in a correlation between DAC-BHW-6 and EPSTEIN.
With PC software, a hysterics curve is drawn in a PC, and the data can be saved and recalled for the further analysis.
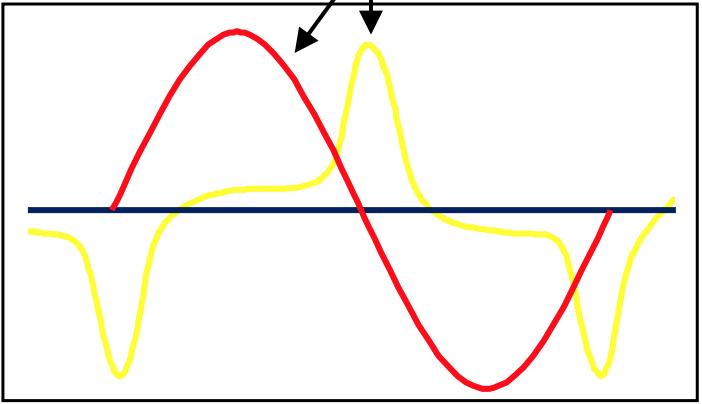
Controlled magnetic flux sine wave
DAC-BHW-6 controls Magnetic Flux in a test sample so that it always forms a sine wave without causing waveform distortion.
Due to waveform distortion, the peak excitation current will not flow
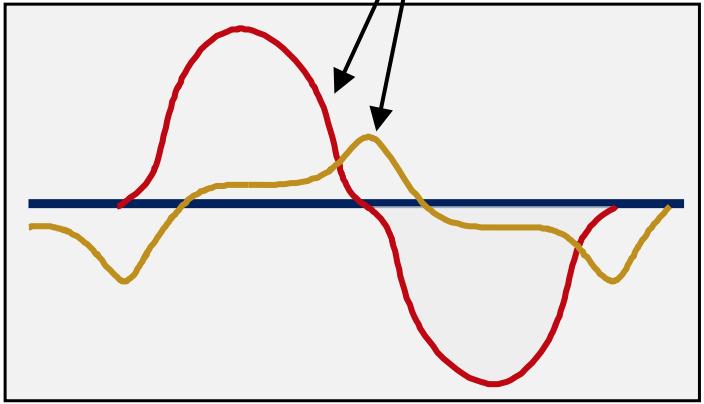
DAC-BHW-6 controls the magnetic flux sine wave (Form factor 1.11). The peak excitation current can be observed.
Software Applications
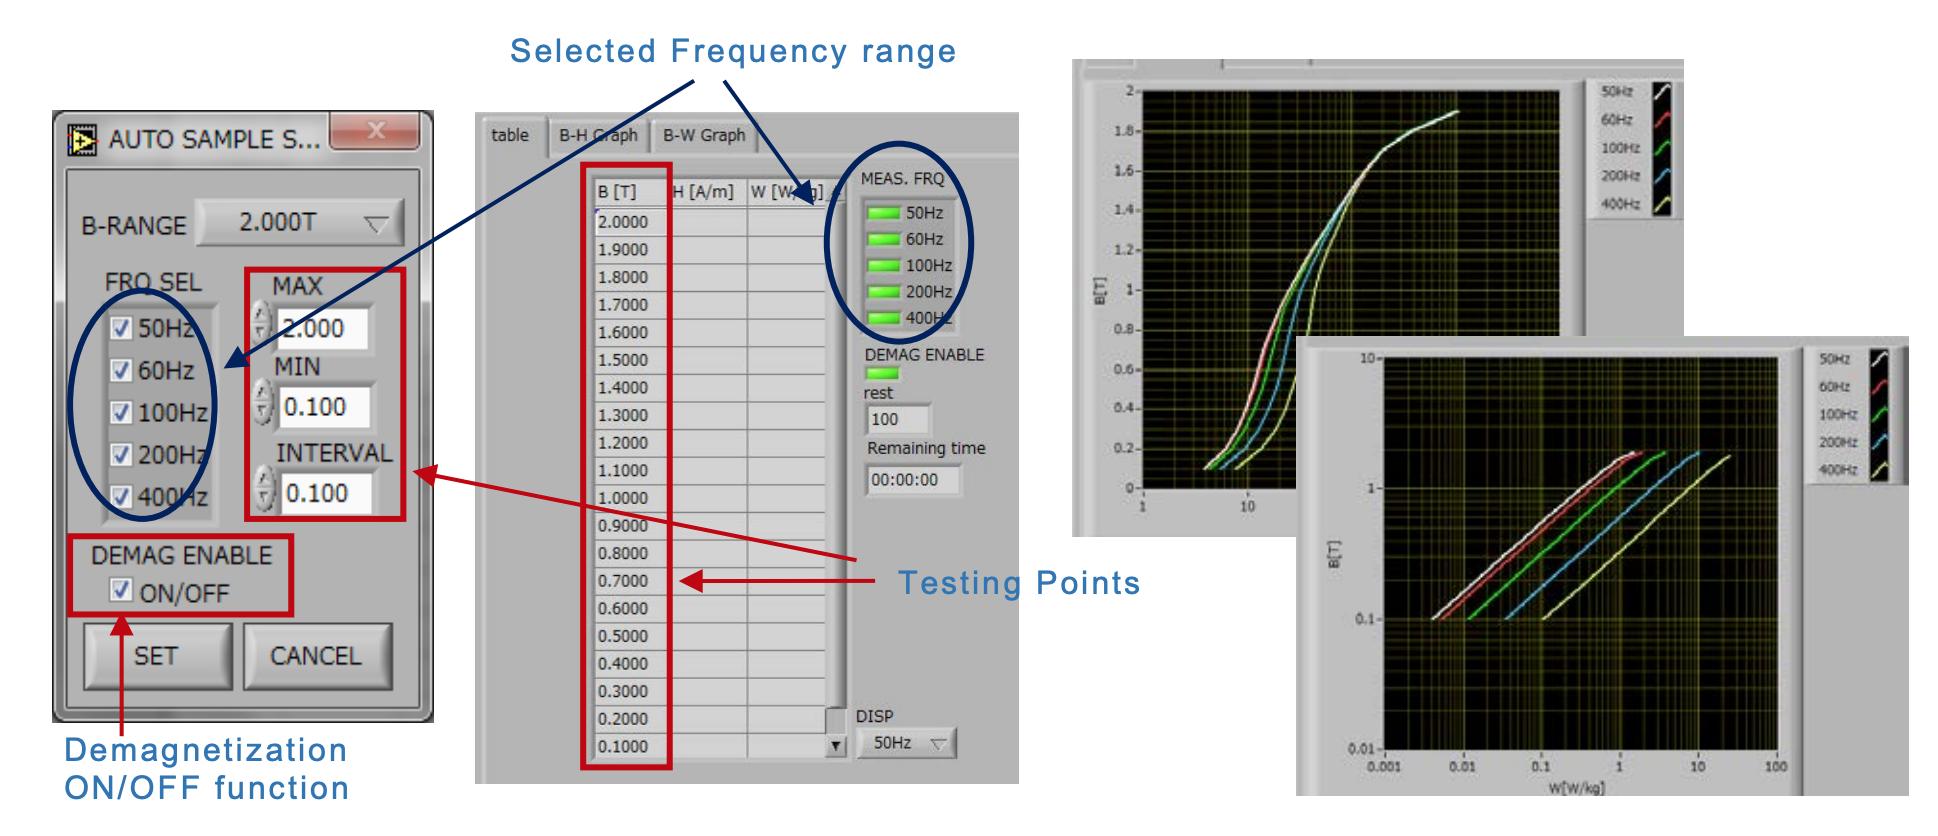
Auto Sample (B-Mode)
In Auto Sample Mode, B-H Graph and B-W Graph of each frequency range are created automatically.
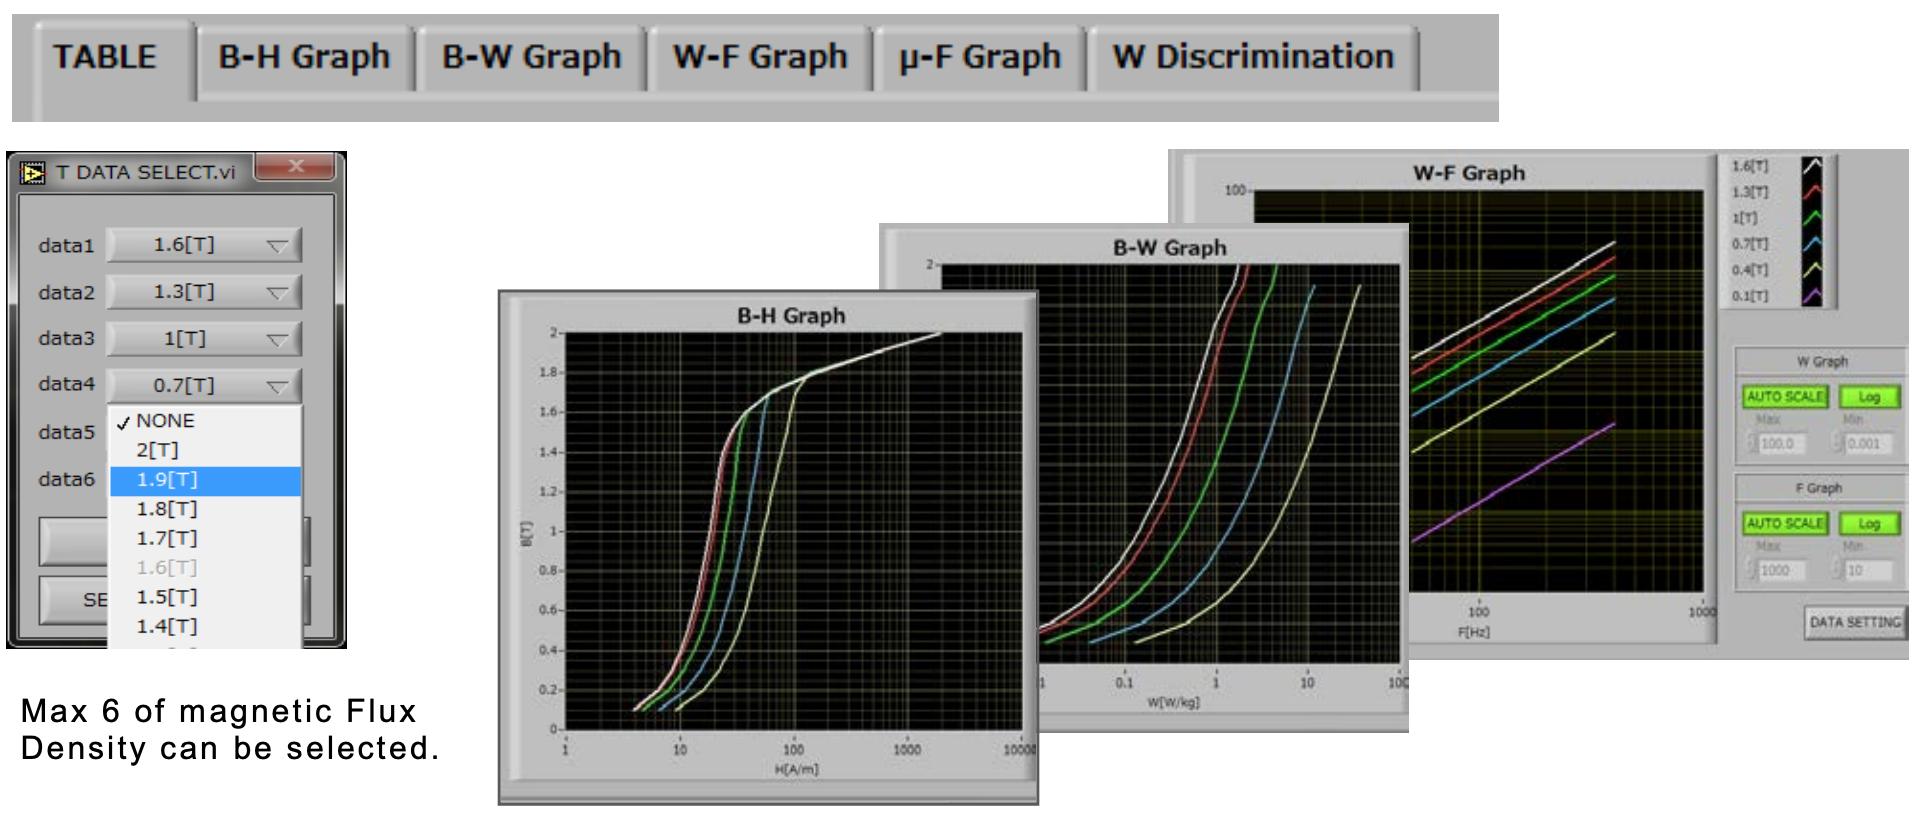
Overlay the B-H Curves of Max 8 Test Data

You can choose Max 8 data from the stored CSV files, and create overlay-graph of B-H curves. Associated information of test conditions will be displayed in a list for easy comparison, and the group data can be saved in .dat format.
Other Graphs
The various graphs enable you to further analyze the characteristics of your samples.
W Discrimination Graph
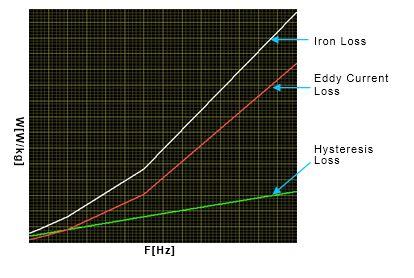
Eddy current loss and Hysteresis loss can be observed separately.
POINT:
Iron loss is mostly expressed as a sum of hysteresis loss and eddy current loss. Normally, as the frequency becomes higher, the percentage of eddy current loss in iron loss becomes larger. Knowing characteristics of iron loss in details is helpful in evaluating the quality of the steel sheet as well as designing it to minimize energy loss.
B-H Curve Observation in a PC
DAC-BHW-6 controls the magnetic flux sine wave even in a high magnetic flux density field. (Form Factor 1.11). By using software, you can observe a B-H curve in a PC and save the data in CSV format.


- Magnetic flux sine wave even in a high magnetic flux density field.
- Measurement at a frequency of 50, 60, 100, 200, and 400Hz.
- B-H curve observation in a PC.
- PC software for various graphs processing and data analysis.
- Discrimination graph of Iron loss to see eddy current loss and hysteresis loss separately.
- Closely coincident results with data obtained by Epstein Method.
- No influence by gaps in a magnetic path by introducing the original magnetic circuit.
- Easy and simple operation from LCD touch screen.
- Compact and lightweight.
- Manual and Auto Sample testing.
Specifications
| Magnetization Condition | Sinusoidal flux condition | ||||||||||||||||||||||||
| Specimen Size |
| ||||||||||||||||||||||||
| Measuring Range |
| ||||||||||||||||||||||||
| Minimum Resolution |
| ||||||||||||||||||||||||
| Measuring Accuracy (electrically calibration) |
| ||||||||||||||||||||||||
| Measuring Frequency | 50Hz, 60Hz, 100Hz, 200Hz, 400Hz | ||||||||||||||||||||||||
| Interface | USB | ||||||||||||||||||||||||
| AC Input | 100V-240V ±10% 50/60Hz | ||||||||||||||||||||||||
| Size and Weight |
| ||||||||||||||||||||||||
| Standard Accessory | BH Detector, Detecting coil D1 and D2, Connecting cable, AC cord, Operating manual, Software | ||||||||||||||||||||||||
To ensure accuracy in testing electrical steel sheets, prepare and measure test samples as shown below.
1) Appropriate test sample size is width of 30mm and length of 60mm or more, and it must be cut using a typical shearing machine (warping of 20μ or less, shear angle of 1° )
2) For grain-oriented cores, anneal it in the way recommended by the steel manufacturer.
3) Test samples must be without warp or twist.
4) Measure several test samples, and take the average.
5) Especially at very low magnetic field measurement, uncertainties of magnetic material’s nature should be considered.
Do you have a Electrical Steel Sheet Tester that needs to be calibrated?
We offer standard traceable calibration and ISO 17025 accredited calibration services.
Get your Electrical Steel Sheet Tester calibrated today! Click Here!
There are currently no reviews for this product.